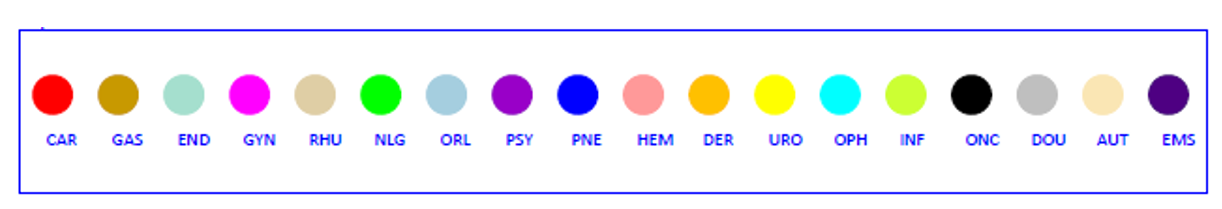
| CAR | Cardiology |
| GAS | Gastroenterology |
| END | Endocrinology |
| GYN | Gynecology |
| RHU | Rheumatology |
| NLG | Neurology |
| ORL | Oto-rhino-laryngology |
| PSY | Psychiatry |
| HEM | Hematology |
| DER | Dermatology |
| URO | Urology |
| OPH | Ophtalmology |
| INF | Infectiology |
| ONC | Oncology |
| DOU | Pain |
| AUT | Other |
| EMS | Nursing home |
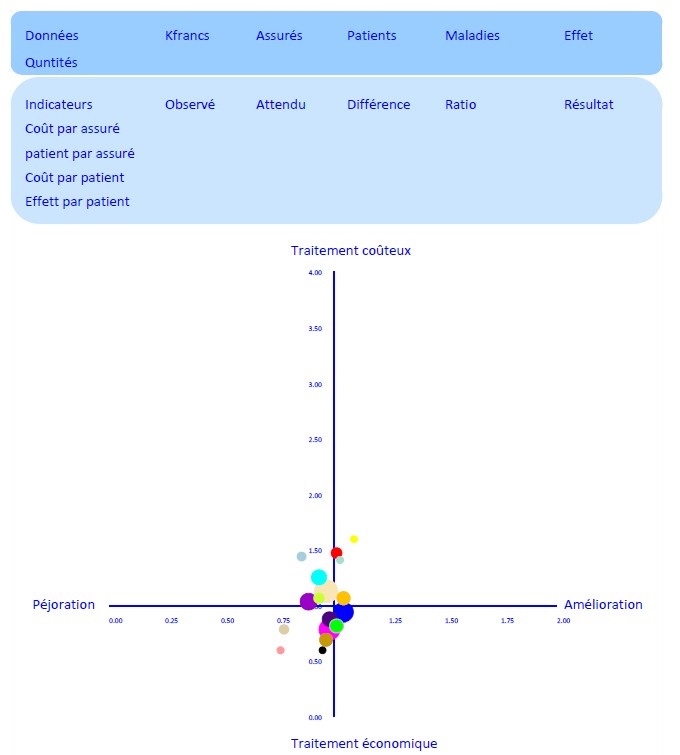
Aim: Describe the cost and efficacy of a reference’s physician
Descriptors (dark blue): The top of the dash board provides main descriptors: costs (thousands of francs), numbers of insured, patients, disease, and the effect (healing or pejoration). The costs is equal to the sum of ambulatory services (except hospitalizations’ costs). The number of insured corresponds to people who designed a specific medical doctor as reference doctor. The number of patients is the count of insured having at least one contact with the reference doctor.
Indicators (light blue): Four indicators are given : cost per insured, number of patient per insured (for instance 0.6 if 40% of patients never visited the reference physician during the year), cost per patient, effect (healing score) per patient.
Observed values are compared to expected values through
– ratios = observed/expected values
– difference = observed – expected values
Performances: The Y-axis expresses the costs, with observed values exceeding expected ones above the horizontal line.
The X-axis expresses the healing of patients, with observed values exceeding expected ones on the right of the vertical line.
Each circle represents a group of patients allocated to the same specialty, with a surface proportional to their numbers.
Interpretation: The interpretation depends on the place of the circle on the graph:
| High costs for patients becoming more and more costly | High costs for patients becoming less and less costly |
| Low costs for patients becoming more and more costly | Low costs for patients becoming less and less costly |
These results should be interpreted with caution. Are data reliable? Are indicators based on a sufficient number of patients to be representative? The adjustment is made by age and diseases, but is it possible that patients are suffering from unmeasured or more severe diseases ? Are costs influenced by outliers?