Aim: Compare ambulatory costs per insured, with decomposition of the difference in following components:
– demographic characteristics of patients
– their propensity to consult
– their diseases
– medical practices
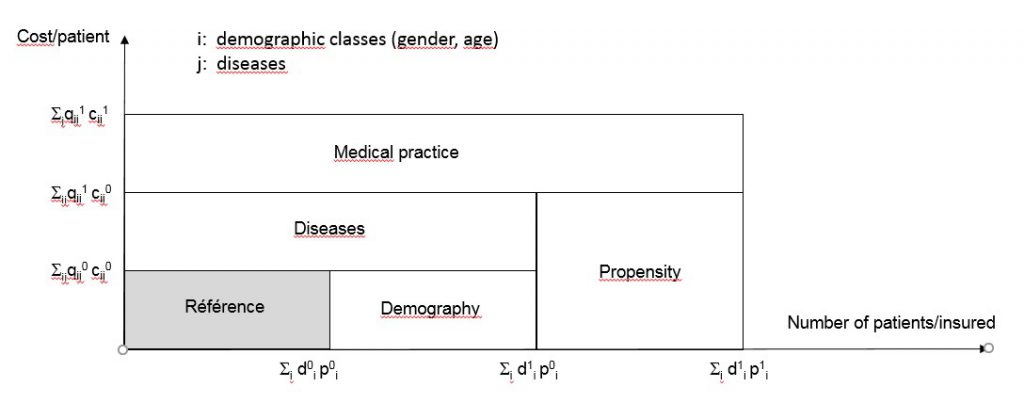
Definition: The cost per insured is equal to the product of the cost per patient and the number of patient per insured.
The cost is equal to the sum of the quantity of visits (q) weighted by their unit cost (cost per visit c). Visits are characterized by the diseases and the age of the patients (ij).
The number of patient per insured is equal to the sum of the number of insured (d) and their propensity (p) to visit him. Insured are characterized by their age and gender (i).
Ambulatory costs include all health costs covered by LAMal (gross amount), except if the nature of the bills are hospitalizations, semi-hospitalizations, nursing home, and maternity, which are all beyond the influence of reference physicians (generalists and internists). Semi-hospitalizations correspond to :
– bills with « day hospitalisation » as nature
– bills greater than 1000 CHF if the specialty of the provider is cardiology, ENT, gastroenterology, gynecology & obstetrics, hematology/oncology, ophtalmology, orthopedics, surgery, transport, urology, day hospitalisation (specific list updated every year).
Method: Observed values are represented by the index 1 and expected ones by the index 0.
The surface of the big rectangle, represented by Σij q1ij c1ij (observed cost per patient) on Y-axis and by Σi d1i p1i (number of patients/insured) on X-axis correspond to observed costs per insured.
The surface of the little rectangle, represented by the same quantities but with 0 indexes, corresponds to reference cost per insured.

The difference between both rectangles corresponds to the cost difference. This surface covers four components, which explains the difference:
- Demography (age and gender of the population).
- Propensity to use health services.
- Diseases (case mix)
- Medical practice
Interpretation: Reference physicians are mainly responsible for the medical practice component. They might be partially responsible for the propensity to consult if they invite patients to contact them once per year (monitoring, preventive medicine, other). Clearly, they are not responsible for the demographic component. Theoretically the disease component cannot be imputed to physicians, but it is possible that some drug treatment influence partially the measured case mix.
Validity of the results: Demographic and propensity to be patients are based on reliable data. Correctly documenting diagnoses is a difficult task, especially without having access to hospital morbidity. The SQLape grouper is relatively accurate, since patients are classified into 262 risk groups based on diagnoses deducted from prescribed drugs, age, complexity (number of diagnoses) and possible hospitalization. We followed the recommendations to avoid misallocation of diseases from drugs1.
1Halfon P, Eggli Y, Decollogny A, Seker E. Disease identification based on ambulatory drugs dispensation and in-hospital ICD-10 diagnoses: a comparison. BMC Health Services Research 2013, 13:453.
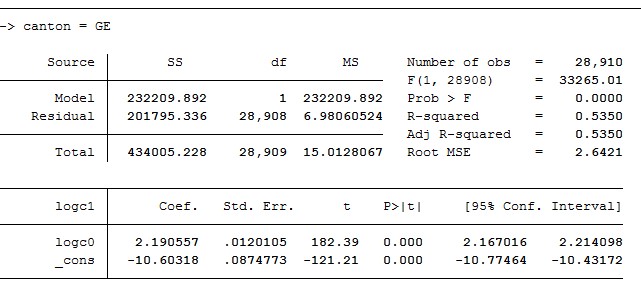
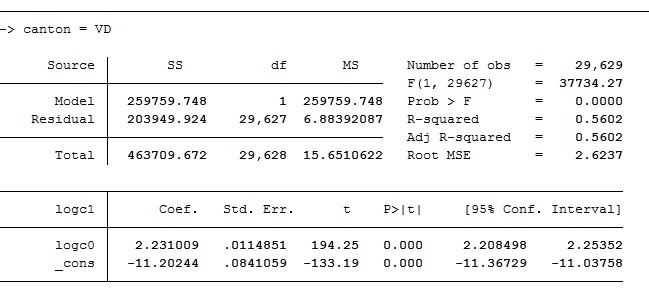
In spite of the lack of hospital morbidity, ambulatory cost prediction power achieved R2 values ranging between 51 and 59% depending on the cantons, which is relatively high compared to other ambulatory costs prediction models.


